


/_Cropped%20Version/_Cropped%20SVGs/ZayZoon%20Logo-FC-Cropped-Slate%20text.svg)
/_Cropped%20Version/_Cropped%20SVGs/ZayZoon%20Logo-FC-Cropped-white%20text.svg)


Product Ops isn't something I'd say we've successfully made the most of, but it is competency we’ve invested in and continue to actively develop as an organization. The most critical piece in our ability to Scale Up over the next few years is the ability to generate rapid insights and use them to allocate our time and energy where it is most likely to move the needle.
As a result of this investment, I’m proud to say we have world-class Product Ops capabilities at ZayZoon, and they are playing a massive role in keeping us focused on changes that matter, on making smart bets, and on helping us discover product & growth opportunities quickly.
When our Product Ops journey started, we set out to accomplish a few different things:
- Shine a bright light on low-hanging fruit and underperformance in the product areas where we have product-market fit
- Lower the barriers to discovery in the product areas where there is high uncertainty (ie. experimental or adjacent features, new products)
- Empower anyone in the organization with enough curiosity and initiative to be able to find answers where they are theoretically available (across all domains of data we should have access to)
- Stoke that curiosity and demolish the mental barriers people have to using data
On #1 and #2, we are now world-class, A+ marks there. There are several people in our organization who can use the tools we’ve set up to get answers. #3 I’d say we are maybe a B+. I see more of our team asking questions and learning the basics of using our BI tools to answer them for themselves. There’s unquestionably more we can do to lower the barriers, and a lot of that has to do with #4, which takes time and constant evangelism. My gut is that there’s a tipping point where if at least 1 person in each working group has the capability and inclination, we’re good. Side note: If anyone has any tips on stoking that curiosity and confidence.. Please comment!
So how do we do it? Enter Product Ops..
A few weeks ago, Marty Cagan (author & product mastermind from the SVPG) posted an Overview of Product Ops. In it, he outlines six Product Operations Models he’s seen from working with hundreds of companies. The final model (ie. the right one) is the “Force Multiplier Model”. In it, qualitative and quantitative insights are combined with tools and best practice evangelism to lead to high levels of empowerment, smart bet-making, and ultimately impact on business outcomes. The only capability I’d add to Cagan’s Model is trivializing the effort to run experimentation. That aside, this is the only model that matters. All the others are cheap rebrands of other functions to fit the Product Ops buzz.
Product Ops is and should be treated and invested in as a major amplifier on all the aptitude and intelligence inside an organization’s walls.
An organization with an ideal Product Ops setup feels like this:
- It takes less time to find answers and validate assumptions than it does to express opinions, so inaction due to disagreement is easy to eliminate, it’s less work to see past noise and teams operate together more effectively and efficiently.
- The default is to look outside the organization’s walls for answers (the old Pragmatic Marketing NIHITO concept) – including behavioral, qualitative, experimental, and experiential insights so that knowledge is dissipated at all levels and there’s less reliance on leadership setting agendas.
- It’s easy to make connections between different domains of data – transactional DBs, web analytics, CRM, support tools, dev trackers, email analytics, app stores, digital ads, marketing automation, financial reports – so that everyone has an intuition for what “should be knowable”, thinks of the business as a system, and has a solid grasp on the big picture.
- Data and discovery are leveraged by all teams to make decisions based on insights, leading to high alignment across functions, extreme context awareness, and scalable empowerment, so anybody can explain surges and dips, and people’s stories start from the truth.
- Data depth is used with Advisors and the board to better leverage expertise around your company (especially if you have a killer board like ours), to help turn general conversations into specific ones and enable real-time deep dives.
- People know what has worked and what hasn’t so that you can double-down on the former and either iterate on or avoid repeating the latter – this has the side effect of improving the ability to scale teams and onboard quickly.
So, what superpowers are needed to reach this ideal?
There are a number of tools out there that can help you get a pretty decent leg up in achieving the “feel” I describe above, but, spoiler alert, there is no one tool that will do it all. So, like any good Product person worth their salt, rather than worrying about what’s available, I’ll explore some of the problems we need to solve in order to get this right.
SUPERPOWER #1 - RETROACTIVE EVERYTHING-TRACKING AT A USER LEVEL
First, you need to establish a baseline for performance, whatever you define performance as – acquisition conversion rates, utilization, retention and user churn, etc. In order to do this, you need to be able to look back at history. The trouble with this is, if you’re anything like us, you didn’t think to set up detailed tracking years ago when your product first got out into the wild, and even if you did, there will be new questions that arise as you’re poking around doing deep dives that you didn’t set up tracking for. So, you can start tracking those things, but then you need to let it sit, for days, weeks, months, until you have a baseline. This kind of soak-in period for insights is not something most ScaleUps can afford.
So, problem #1 is that you need a way to track everything anyone has ever done, at a user level, retroactively. Can you get there? No, not fully. If you didn’t track your website traffic in 2017, it’s unlikely you’ll be able to get that back. But, for most things that matter, you can get pretty close.
Sadly, even the best product analytics tools out there (Amplitude, Segment, Mixpanel, Heap) don’t get you this fully. Many do start with a “collect everything” approach and that can get you part of the way there, but ultimately they all require you to proactively tool your meaningful events in order to track them. In fact, John Cutler, a well-respected Product Guru from Amplitude, alluded to this in a post just yesterday, highlighting the temptation to overthink, over-tool and as he puts it, prematurely converge, in response to the required soak-in period for those metrics to lead to insights.
At ZayZoon, we’ve been able to build a comprehensive table of all events – everything from arrival at and completion of onboarding steps, to support conversations, to campaign-driven app visits, to blog article reads, to mobile app installs and version updates. Notably, we can also retroactively define user-related but not user-initiated events – for example, back-end occurrences like webhooks we’ve received about that user or specific jobs we’ve run in the background that has yielded a certain result.
Most importantly, all of these can be re-defined at any time, and new events with full retrospective history can be created in minutes. This is the holy grail of product analytics and, honestly, I don’t know how we’d move as efficiently as we do without it.
SUPERPOWER #2 - DEFINING CUSTOMER SEGMENTS BASED ON ANYTHING
Second, having everything tracked for every user is great, but you need to be able to aggregate that performance and compare different groups of users. This helps you distinguish the best-performing groups from the worst-performing groups, and shed some light on ways you can make the latter more like the former. Again, the trouble with this is that “groups of people” (ie. segments) stretch far beyond the most obvious/readily-available user characteristics.
Yes, you do often want to look at people based on demographics. But you also need to be able to group based on how they were acquired, when they did something (ie. cohorts), how they did something, if they did something etc, obscure characteristics that you need to dig out of raw unstructured data, the devices they use to access your application, whether they were affected by an outage, if they’re part of a split test, other characteristics that require calculation, campaign attribution, other “stateful” things like “was X true when they signed up?”, whether they are dog people or cat people or bird people (shudder), whether they have an unfortunately placed mole.. ..the world is your oyster.
There are infinite ways to group customers, and it’s impossible to predict today what groups will be relevant to tomorrow’s questions. So, problem #2 is that you need a way to retroactively define groups of customers based on anything you know about them.
At ZayZoon, if there’s a way to determine segment membership for a single given user, we can add new segment definitions for all users within a few minutes and those can be used in drilling down on data performance.
SUPERPOWER #3 - PUTTING DATA WITHIN EVERYONE’S REACH
Third, all of this is for naught without a solution to problem #3: you need an easily accessible and understandable way for anyone and everyone to navigate the data and get their own answers and insights.
Part of this is tooling, part of this is training, and part of this is getting the basics right. You should not need to be a data scientist to understand what an acquisition funnel is, nor what utilization and churn mean, but there are basics of product analytics that HAVE to be set up and spoon-fed to the point where they’re trivial to find and navigate. Note: There are some must-haves in Product Analytics which I list at the end of the article.

These graphs and charts, well-organized, and with the ability to slice-and-dice against any segment of users can in and of themselves lead to insight. However, more importantly, they can inspire deep dive questions that lead to impactful ideas for features and experiments. As a side effect, if the data people are using is all coming from one place, there will be less time spent questioning methods and data reliability, and more time spent deciding and understanding meaning.
Also, this is not just about accessing quantitative data. We need to consider observational data – and find a way for everyone inside an organization to experience what users experience. For this dogfooding can work well to expose the obvious, if it’s feasible and you don’t depend on it exclusively. On top of that get FullStory – or something like it that allows you to actually watch user experiences retrospectively, even if you didn’t know you were going to need to and weren’t recording anything specific.
Where data just isn’t available, make it easy to get it by putting questions where users are. When we have a question that can’t be answered with our data (e.g. how much of our customer base watches 90-day fiancée?), we can place a question right where our users are that get us an answer pretty darn quickly.
At ZayZoon we have basic acquisition charts which are used by our pod teams to figure out where to introduce or remove friction and where to design interventions. Almost all of our teams regularly jump into FullStory to see what certain groups of customers are experiencing and quickly sanity-check and measure features post-release, and we can even launch in-app messages and surveys to get feedback from customers, triggered by any behavior. None of this requires coding, it all can be done within minutes.
SUPERPOWER #4 - TRYING & MEASURING IDEAS RAPIDLY AND AT EXTREMELY LOW-COST
When you’re in a ScaleUp mode you likely have some product/market fit, but it may not be a perfect fit and there is usually still an ample degree of uncertainty. As a product team, there are ways to do discovery to figure out what bets to make (if you haven’t already, check out Teressa Torres’ Continuous Discovery Habits).
What’s certain is that it can be very expensive to build, which leads us to problem #4: you need a way to try things out at a low cost to test organic interest. This is particularly true for big swing items when you already have a strong sense of the user persona problem space and want to validate your solution.
This is one of the most important elements of Product Operations that make insights easy to gain. When existing data does not shed enough light on an idea to justify an investment/bet, getting something out in the wild is by far the best way to get insights, particularly if it is extremely low cost, and extremely easy to walk back. I maintain that there’s no amount of interviewing or functional prototyping or demoing that will get you the same richness of feedback and insight as to when you have a real thing out in the hands of people (even if it’s crap).
At ZayZoon we use a combination of embedded pages (literal pages from our marketing CMS embedded into our app), embedded reports (again, no bespoke graphing libraries), in-app surveys, and in-app messaging frameworks to build working version-zeros in hours and get results in minutes. This has the added benefit of involving everyone in the process of building for discovery. Having sales and customer success implement a crappy version of a feature without code to prove it works (or doesn’t) helps you skip several steps. And since codeless build also means codeless iteration, it also helps you hone in on the solution quickly when you don’t get it right on the first crack (ie. most times). Some of our most profound product interventions in the last 2 years have resulted from this being able to try things out at little or no cost.
SUPERPOWER #5 - KEEPING TRACK OF WHAT WE’VE TRIED
Lastly, it’s not always easy to understand what is and what isn’t moving the needle on the outcomes you care about, which brings me to problem #5: you need to be able to look back at surges and dips in performance and understand what led to them.
This one is easier said than done. You need to keep track of what you’ve tried, in one place, period. There are so many things that can move the needle on business outcomes and performance. The lines between Product and the rest of the organization should be intentionally blurry, and you should be tracking every intervention whether it’s a feature, product launch, customer marketing campaign, webinar you ran, new sales activity, 3rd party outage, or in some cases, macro-economic events (ahem, pandemic labor market disruptions). Ideally, you would have the ability to overlay the timing of key interventions on any performance chart (or at the very least, cross-reference it).
The key here is to break down tunnel-vision and silos because a) the things that are impactful in achieving great outcomes can come from anywhere, b) the things that aren’t impactful are forgotten. Knowing what does and doesn’t work across the organization, is hard to do because, at any great team, you’ve got many many highly productive and highly competent individuals trying to move the needle so there are often tens of initiatives on the go.. it’s also difficult because the impact horizon for initiatives isn’t always immediate. Companies like DoubleLoop are trying to solve this problem (and Daniel Schmidt, I still owe you some feedback.. sorry!) and tighten the learning loop for businesses.
Truthfully, I’m not sure anyone really does this super well, but even getting close can drastically improve an organization’s ability to scale without losing organizational knowledge, and there to build on each other’s ideas, failures, and successes.
Again, tips and tricks are welcome here.. how does your org do it?
So, how do you get started?
Well, as I said at the beginning of the article, this is a competency we are still actively trying to develop. That said, we’ve achieved some world-class tooling around our Product Operations. It feels like our team is more and more empowered and that data drives our discussions more than opinion.
If I were to give advice on what to do, I’d lay it out as follows.
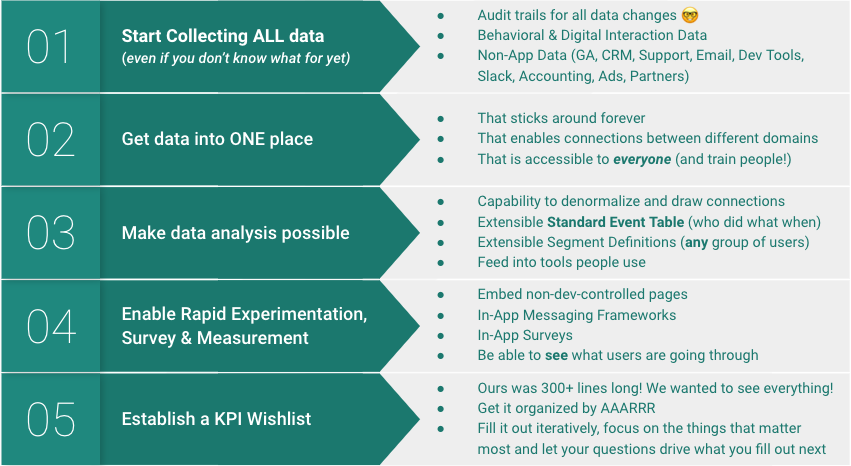
It looks like a lot, but once you make sure you’re capturing all the data (even if you’re not doing anything with it), everything else can be done in phases. In most cases, capturing and persisting data is just a matter of turning things on (e.g. data audit trails, tracking, storing raw API data, enabling a CDP-like Segment).
Once that foundation is in place, create a KPI wishlist as a starting point. It will grow over time but if you lay it out, you can then focus on the most important questions first, and let your questions drive the iteration. You’ll need some technical chops in-house or available to you (something akin to a growth hacker) and then a hodge-podge of really useful tools.
If anyone’s interested, I’m happy to walk through the Data and Rapid Iteration stacks we’ve built here at ZayZoon. We’ve developed capabilities that very few companies at our stage (or any stage for that matter) have, and I’m enormously proud of them… …or if there’s enough interest, maybe I’ll do another post!

We’re Hiring!
Our Product team is unlike any other and I’ve got several roles open that all take advantage of this awesome world-class Product Ops setup we’ve got. If you’re interested, I strongly encourage you to apply!
Some Product Analytics Must-Haves
Not an exhaustive list by any means, but here are a few that we look at often..
- Acquisition Funnel Drop-Off (by the #s, by the $s) - Helps identify friction in usability and intent/trust
- Acquisition Velocity by (#s, by #s) - Helps untangle usability friction from intent/trust friction
- N-Day Retention Burndowns (based on whatever event makes a user active, but also based on any compelling event) - acts as an input into utilization periods
- Utilization Period & Frequency (again, based on the event that makes a user active) - helps you figure out what to consider active vs. dormant vs. churned
- Active vs. Dormant vs. Returning User trends (again, based on the event that makes a user active) - helps you understand your growth drivers and leaks
- Cohort Retention Tables -- helps you understand your lifecycle durations
- Customer Segments - helps you know your customers
- Cross-Segment Performance – helps you navigate correlations between segments
- Other notable ones:
- Lifetime support/success costs (by #s, by hours)
- Referral Activity (if PLG is part of your growth strategy)
As Marty Cagan put it in his recent SVPG article, Product Ops should be a Force Multiplier on the business, designed to surface insights and best practices, empower teams and in so doing, better allocate time and energy.
There is nowhere this is more true than in a StartUp transitioning to ScaleUp.
Unfortunately, getting insights generally requires foresight and tooling, and as John Cutler highlighted in a post recently, this leads to a temptation to overthink and prematurely converge.
But what if it didn't? What could Product Ops at its very best do to help a ScaleUp soar?